← Presentations · ARVANTTI LABS

Digital Twin with Co-simulation: Water Network

An industrial application example using a scaled water network: co-simulation with Arvantti-Emulator®, Arvantti-DigitalTwin®, and Arvantti-Fractal®, pressure control, a control room, and 24-hour scenario studies.

13 slides · Public utilities and water networks

In presentation mode: use arrows or click to advance, I outline, N notes, F fullscreen, Esc exit.

01 / 13 · Cover and index

Logo Arvantti Labs: Engineering Intelligent Futures

Example of industrial application:
aqueduct digital twin

Fair pressure in every house, with the digital twin
and Arvantti-Fractal® deciding with you

A brand of

Sequoia Space Logo
Presenter notes

Today I am going to show you an example of an industrial application of a digital twin with co-simulation: a scale aqueduct that we built as a reference plant to demonstrate how Arvantti-Emulator®, Arvantti-DigitalTwin® and Arvantti-Fractal® work together. It is a demonstration plant with plausible estimated data, not a real installation, and I am going to tell you honestly what works today, what is in validation and what is coming next. Arvantti Labs is a brand of Sequoia Space.

02 / 13 · Cover and index

Index

What we are going to travel

01

The challenge and the plant

Pressure, leaks and demand in a network at scale.

02

How it works

Emulator, 3D twin, control room and studios.

03

What we check

The two models, face to face.

04

What do you want?

The potential value for an aqueduct.

05

Next steps

How do we start with you?

ARVANTTI LABS · A SEQUOIA SPACE BRAND

02

Presenter notes

This is the route. First, the challenge of operating a water network and the scale plant that reproduces it, with its service rule. Second, how it works: the emulator with virtual PLC, the 3D twin, the control room and the Arvantti-Fractal® studios. Third, what we verified in the tests. Fourth, what can an aqueduct operator earn. And fifth, the next steps. Each title is a link to its section.

03 / 13 · The challenge of a water network, the scale plant and its service rule

The challenge

Operating a water network is a fine balance

Pressure

If it is missing, the furthest house is left without service. If there is excess, everything loses more water.

Leaks

Technical losses, fraud and illegal connections: water that is pumped and not charged.

variable demand

Consumption rises and falls during the day; The ideal pressure at night is not that at noon.

Pumping energy

Each extra meter of pressure is paid for in energy and dissipated in the regulating station.

The everyday question: How much pressure is enough, and no more?

Satellite mascot thinking

ARVANTTI LABS · A SEQUOIA SPACE BRAND

03

Presenter notes

Any aqueduct operator lives with four tensions. The pressure: if it is missing, the furthest or highest house is left without water; If there is excess, the network loses more due to leaks and wears out. Leaks: technical losses, fraud and illegal connections, that is, water that is pumped and not billed. Variable demand: consumption changes throughout the day, and the appropriate pressure in the early morning is not that of midday. And the pumping energy: each meter of pressure that is pumped extra is paid for and then dissipated at the regulating station. The daily question is how much pressure is enough, and no more. That is the problem that our plant reproduces at scale.

04 / 13 · The challenge of a water network, the scale plant and its service rule

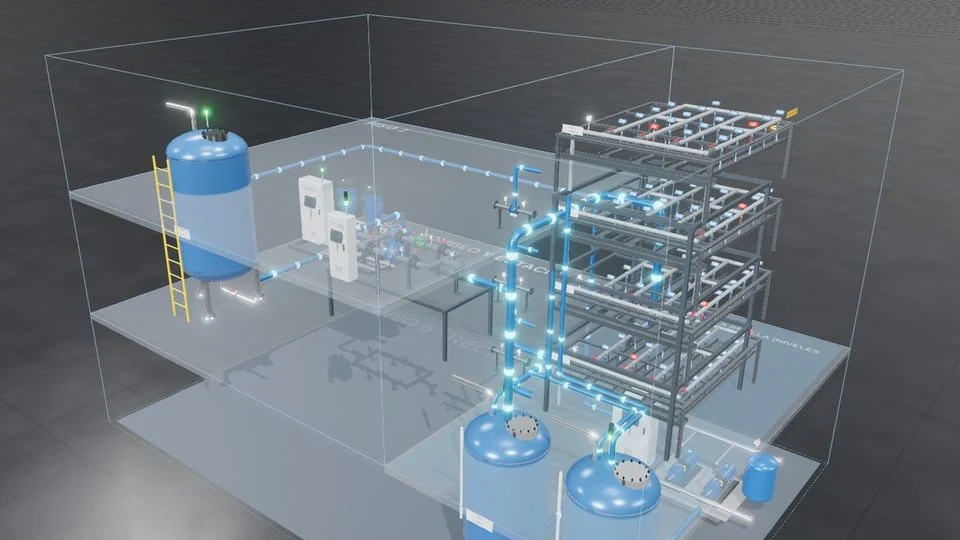
Demonstrative example · The scale plant

A city aqueduct in a building

3D twin of the aqueduct to scale: pumping, regulating station and four-level grid

See in 3D →

Reference plant with plausible estimated data. It is not a real installation.

Pumping: two multistage pumps in parallel, at least 70 mca and peaks up to 80.

Regulating station: It lowers the pressure before the network, in automatic or manual branch.

4-tier grid: 16 houses per level, 64 in total, each with its consumption valve.

Leaks: 2 valves per level, 8 in total, for losses, fraud and illegal connections.

Valves between levels: They regulate the passage of water from one level to the next.

Recirculation: The water falls into gutters, goes down to return tanks and returns to the pumping tank.

ARVANTTI LABS · A SEQUOIA SPACE BRAND

04

Presenter notes

It is a demonstrative example. This is the plant: a scale test bench, mounted on a building, that reproduces a city aqueduct. Two multistage pumps in parallel lift water to at least 70 meters of water column, with peaks up to 80. Mca means meters of water column; 10 mca is approximately 1 bar. The regulating station lowers this pressure before entering the network, through an automatic or manual branch. The network is a four-level grid with 16 houses per level, 64 in total, each with its consumption valve, plus two leakage valves per level, eight in total, which represent technical losses, fraud and illegal connections. Between levels there are regulation valves. And the water recirculates: it falls into gutters, goes down to the return tanks and the recirculation pumps raise it back to the pumping tank. Important: This is a reference plant with plausible estimated data, not a real installation. The View in 3D link opens the floor plan at digitaltwin.arvantti.online; It is a good idea to check that it is open before the meeting.

05 / 13 · The challenge of a water network, the scale plant and its service rule

The service rule

No house below 15 mca

15

minimum mca in the most critical house in the entire network, the furthest one.

15,45

target mca of automatic control: 3% margin above the minimum.

≥ 70

pumping mca; the regulating station lowers what is left over.

Alerts in the critical house:

20 mca

18 mca

15 mca · limit

ARVANTTI LABS · A SEQUOIA SPACE BRAND

05

Presenter notes

The service rule is the same that a real water company would apply. It is not only about the pressure at the outlet of the regulating station, but about the most critical house in the entire network, normally the furthest or the highest: it should never drop below 15 meters of water column, plus or minus 1.5 bar. The automatic control points to 15.45 mca, that is, a 3% margin over the minimum. The pumping delivers at least 70 mca and the regulating station lowers what is left over. There are graded alerts in the critical house at 20, 18 and 15 mca, and the display distinguishes target, warning, alarm and minimum violation. With this the demonstration shows pressure management: less excess pressure, fewer leaks, without leaving anyone without service.

06 / 13 · How it works: Arvantti-Emulator®, Arvantti-DigitalTwin® and Arvantti-Fractal®

How it works

Three pieces and an operator who decides

Arvantti-Emulator®

Signals and virtual PLC

It calculates the network and produces the signals that a real PLC would see. The virtual PLC executes the time plan and controls.

Arvantti-DigitalTwin®

3D plant and co-simulation

The 3D plant moves with the PLC data, saves the history and shows the future separately.

Arvantti-Fractal®

Independent calculator

Your own network model. Project 24 hours, compare the plan with alternatives and recommend.

Arvantti-Fractal® recommends

The operator accepts or rejects

The PLC applies the setting

Arvantti-Fractal® reads the PLC in read only and You never write directly on it.

ARVANTTI LABS · A SEQUOIA SPACE BRAND

06

Presenter notes

This is how co-simulation works, with three products, all registered trademarks of Arvantti Labs. First, Arvantti-Emulator®: calculates the hydraulics of the network and produces the signals that a real PLC would receive; The virtual PLC executes the 24-hour plan and the permitted controls. We use it when the plant is still a project or when it is necessary to emulate field signals. Second, Arvantti-DigitalTwin®: the 3D plant moves with the PLC data, saves the history and shows the simulated future separately, without mixing it with the operation. Third, Arvantti-Fractal®: its own independent hydraulic calculator, which does not use the emulator; reads PLC signals in read only, projects 24 hours, compares current plan with alternatives and recommends. The decision is up to the operator: accept or reject, and only then does the PLC apply the adjustment. Arvantti-Fractal® never writes directly to the PLC. In this demonstration the PLC is virtualized; the same schematic would connect to a real PLC in read only.

07 / 13 · How it works: Arvantti-Emulator®, Arvantti-DigitalTwin® and Arvantti-Fractal®

Demand and scenarios

A day in 24 points, without jumps

Example: progressive scenario of opening of the houses

00:00 · 30 %

12:00 · peak 100%

23:00

Between one time point and the next, demand changes gradually.

THREE WAYS TO EDIT IT

Global

The same opening for the 64 houses.

By level

One opening for each of the 4 levels.

At home

Individual opening for each consumption.

ARVANTTI LABS · A SEQUOIA SPACE BRAND

07

Presenter notes

Each daily scenario is described with 24 time points, and the emulator moves from one point to the next gradually and continuously, without instantaneous steps. The example in the graph is the initial progressive scenario: the houses start at 30% open, rise to 100% at 12:00 and go down again; Minimum, maximum and peak time are configurable. The demand is edited in three ways: global, with the same opening for all 64 houses; per level, with an opening for each of the four levels; or per house, with an individual opening. There is also a seed-reproducible random demand mode, which never touches leaks, and versioned operating templates in addition to proprietary scenarios. The graph is illustrative of the profile shape, not a measurement.

08 / 13 · How it works: Arvantti-Emulator®, Arvantti-DigitalTwin® and Arvantti-Fractal®

control room

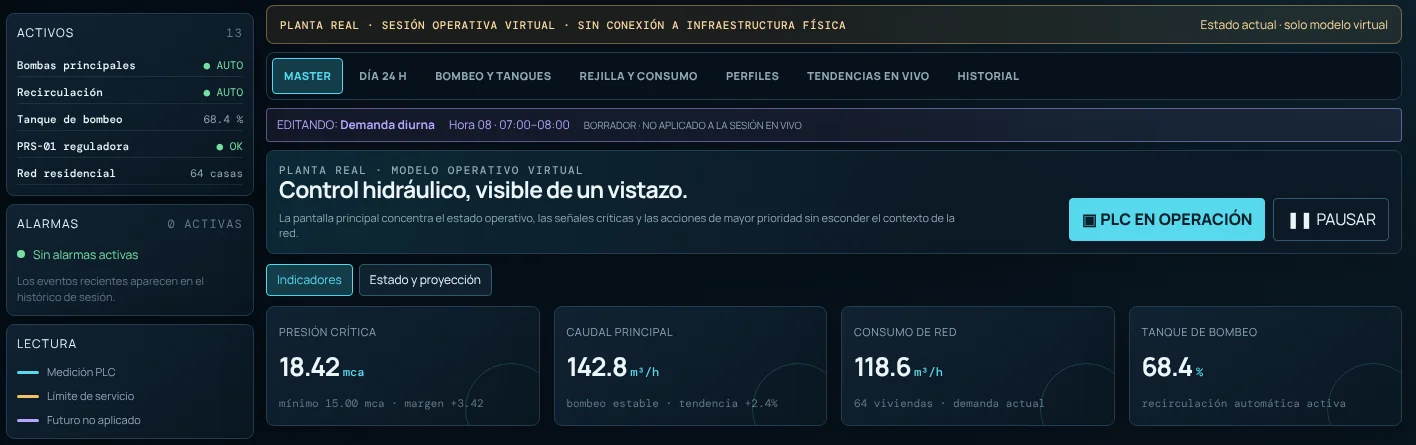
What the PLC reports, on a screen

Aqueduct control room powered by the virtual PLC: pressure, flow, tanks, pumps and grid

Pressure and flow rate of pumping to the critical house

Tanks, pumps and station in AUTO or MANUAL

The 64 houses, with the most critical highlighted

Alarms, events and 24-hour trends

ARVANTTI LABS · A SEQUOIA SPACE BRAND

08

Presenter notes

This is the aqueduct control room, powered by the Arvantti-Emulator® virtual PLC. On a single screen you see the pressure and flow profile from the pump outlet, through the regulating station and each level, to the critical valve; the levels, inlets and outlets of the tanks; the pumps with their flow rate, drive speed, pressures and power; the regulating station in automatic or manual; the 64 houses with opening, pressure and flow, with the most critical highlighted live; and alarms, events and 24-hour trends. All data and control is marked as simulated: there is no connection or writing to a physical PLC here. The same scheme is intended to connect to a real PLC in read only.

09 / 13 · How it works: Arvantti-Emulator®, Arvantti-DigitalTwin® and Arvantti-Fractal®

ARVANTTI-FRACTAL® STUDIES

See the future without touching the operation

3D twin of the aqueduct to scale

SIMULATED FUTURE · NOT APPLIED

The future is seen in a separate, labeled view and is never confused with the operation.

Base projection

What happens in 24 hours if the PLC plan is executed as is?

Alternative

What if the demand or the season changes? It is compared to the base.

Rewind 3D

You review past hours without stopping the PLC. A simulated day lasts 6 minutes (×240).

Optimization

Find the best plan that meets the service rule.

ARVANTTI LABS · A SEQUOIA SPACE BRAND

09

Presenter notes

Arvantti-Fractal® carries out future studies based on what the PLC publishes. The base projection answers what happens in the next 24 hours if the PLC plan is executed as is. The alternative scenario answers what happens with a hypothetical change in the operator, for example in demand or in the regulating station, and is compared with the base. The future is shown in 3D as a separate view, translucent and labeled as a simulated future, not applied, so that it is never confused with the operation. The twin also saves history: you can review past hours without pausing or rewinding the PLC. The clock runs by default at ×240: a simulated hour every 15 real seconds, a day in six minutes. Optimization, which would propose the best plan that meets the service rule, is the next step and today it is turned off on purpose, until the forecast is validated. No study changes the operation on its own.

10 / 13 · What we check

What we check

Two models, face to face

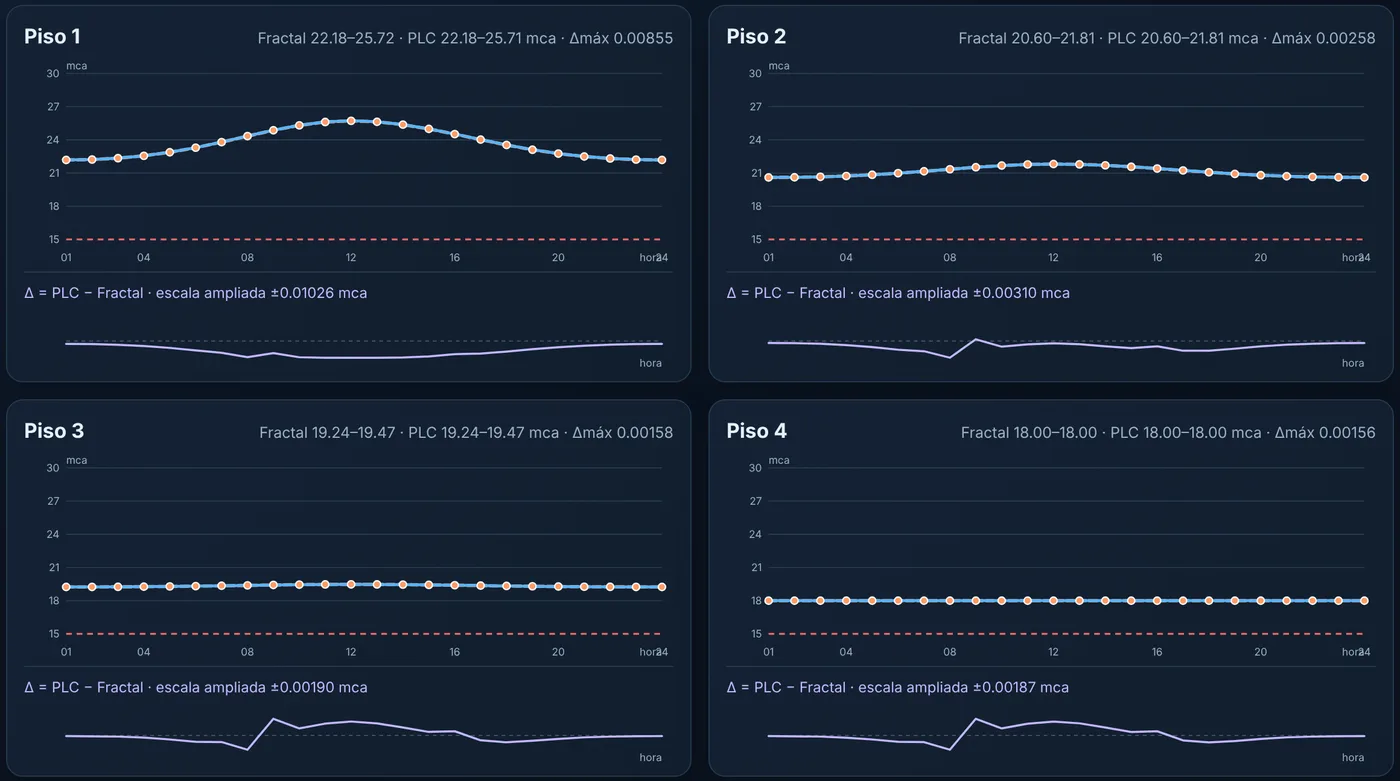
PRESSURE MODELS MATCH

Minimum pressure per floor for 24 hours: emulator and Arvantti-Fractal® almost coincide, always over 15 mca

Zoom in on the difference between real, co-simulation and optimization. In 24 hours no house fell below 15 mca; The models differ by less than 0.01 mca.

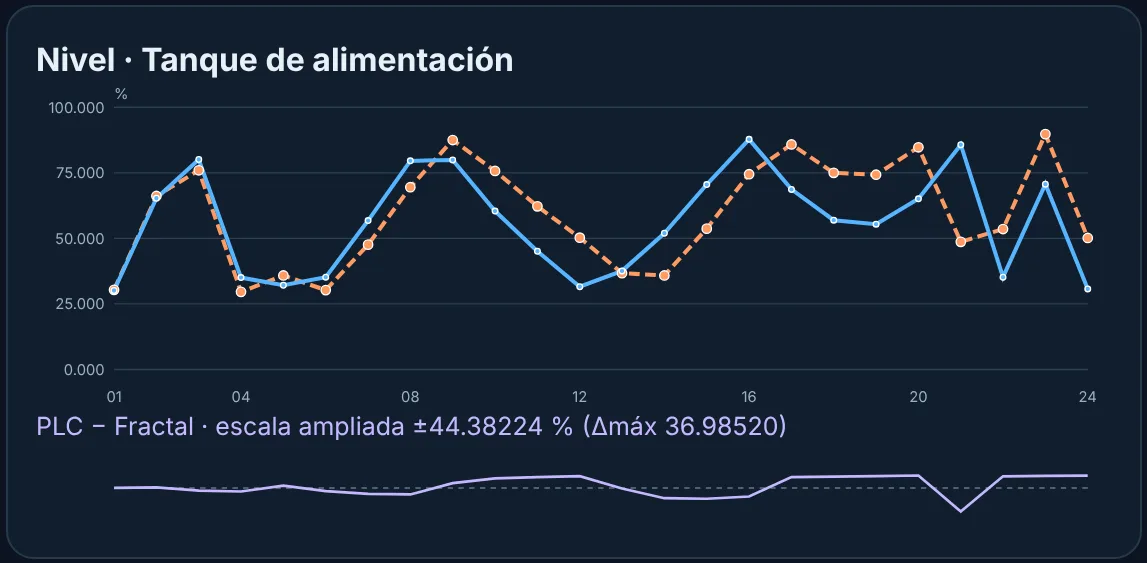
TANKS · DISCREPANCIES IN SIGHT

Feed tank level per hour: emulator and Arvantti-Fractal® separate

Allows you to view discrepancies between your plan and your actual operation, such as the hour-by-hour supply tank level.

ARVANTTI LABS · A SEQUOIA SPACE BRAND

10

Presenter notes

To trust Arvantti-Fractal® we compare it against the emulator, which acts as reality. On the left, pressure: In a test scenario with the station on automatic and a target of 18 mca on the furthest house in level 4, we checked all 64 houses every second for 24 hours. None fell below 15 mca; the minimum was 17.52. Fractal also evaluated 72 cases, 24 hours a day with demand at 90, 100 and 110%, and all were over 15 mca. The floor pressure curves of both models differ by less than one hundredth of a mca. This view zooms in on the difference between real operation, co-simulation, and optimization. On the right, tanks: this view allows you to visualize the discrepancies between the plan and the actual operation. In the continuous 24-hour run, the level of the supply tank separated up to 34.27 percentage points at hour 18. There is no lack of water: the total volume of the three tanks is almost the same in both models; What changes is the moment in which it starts and stops recirculation. The graph on the right is for the critical point scenario, with a lag of the same type. They are model results, not measurements of a physical installation.

11 / 13 · What an operator earns, next steps and contact

What do you want?

What an aqueduct can gain

Less pressure to spare

Fewer leaks and less pumping energy, without leaving homes without service.

Anticipate

You see the next 24 hours before they pass.

Decide with data

You compare the current plan with alternatives before moving anything.

No risk

Read in read-only; your team always has the last word.

In the scale plant model, the automatic branch reduced leaks 6,4 % versus the manual.

Potential benefits. The figure is a simulated result, not a measurement; The real impact is estimated with your network.

ARVANTTI LABS · A SEQUOIA SPACE BRAND

11

Presenter notes

What can an aqueduct operator earn? I'm talking about potential, not measured results. First, less excess pressure: by regulating through the most critical house and not through the station outlet, the pressure can be lowered when demand drops, with fewer leaks and less pumping energy, without leaving anyone without service. Second, anticipate: see the next 24 hours before they happen. Third, decide with data: compare the current plan with alternatives before moving anything. And fourth, without risk to the operation: the connection is read-only and the decision is always up to your team. As a reference, in the scale plant model, the automatic branch of the station reduced leaks by 6.4% compared to the manual branch with the fixed output of the day. It is a simulation result on estimated data, not a measurement; The impact on your network is estimated in a diagnosis.

12 / 13 · What an operator earns, next steps and contact

Next steps

From the test bench to your network

01

Validate tanks

Repeat the entire day and close the difference in levels.

02

Speed ​​×240 live

Full physics at ×240 live, not just precomputed.

03

Connect a real PLC

Read-only, with your signals mapped to the model.

04

Start-up

A sector of your network; With the forecast validated, turn on optimization.

Is your network still a project? We start with Arvantti-Emulator® and your virtual PLC.

ARVANTTI LABS · A SEQUOIA SPACE BRAND

12

Presenter notes

These are the next steps. One: validate the tanks, repeating the 24-hour run with the stable PLC sample and closing the difference in levels. Two: achieve ×240 speed live with full physics; today the entire day at that speed is played precalculated. Three: connect a real PLC in read-only, mapping your signals to the model. And four: the launch in a sector of your network, where we validate the forecast with real data and only then turn on the Arvantti-Fractal® optimization. If your network or your plant is still a project, we start with Arvantti-Emulator® and its virtual PLC simulation. All are registered trademarks of Arvantti Labs.

13 / 13 · What an operator earns, next steps and contact

Let's talk

What sector of your network do you want to see before it happens?

Tell us your network and we will put together the first step.

Andres Quiceno

Engineering CTO

[email protected]

Satellite mascot celebrating Arvantti Labs Logo

A brand of

Sequoia Space Logo
Presenter notes

We close with an open question: what sector of your network do you want to see before it happens? Based on your answer, we propose the scope of the first step with Arvantti-Emulator®, Arvantti-DigitalTwin® and Arvantti-Fractal®. My contact information is on the screen: Andrés Quiceno, CTO of Engineering, [email protected], and the LinkedIn sites and pages of Arvantti Labs and Sequoia Space.